Professional-grade terminal in your browser
Stop paying for 10 different tools when you can have everything in one place. Professional grade macro terminal, right in your browser. No downloads, no hassle.


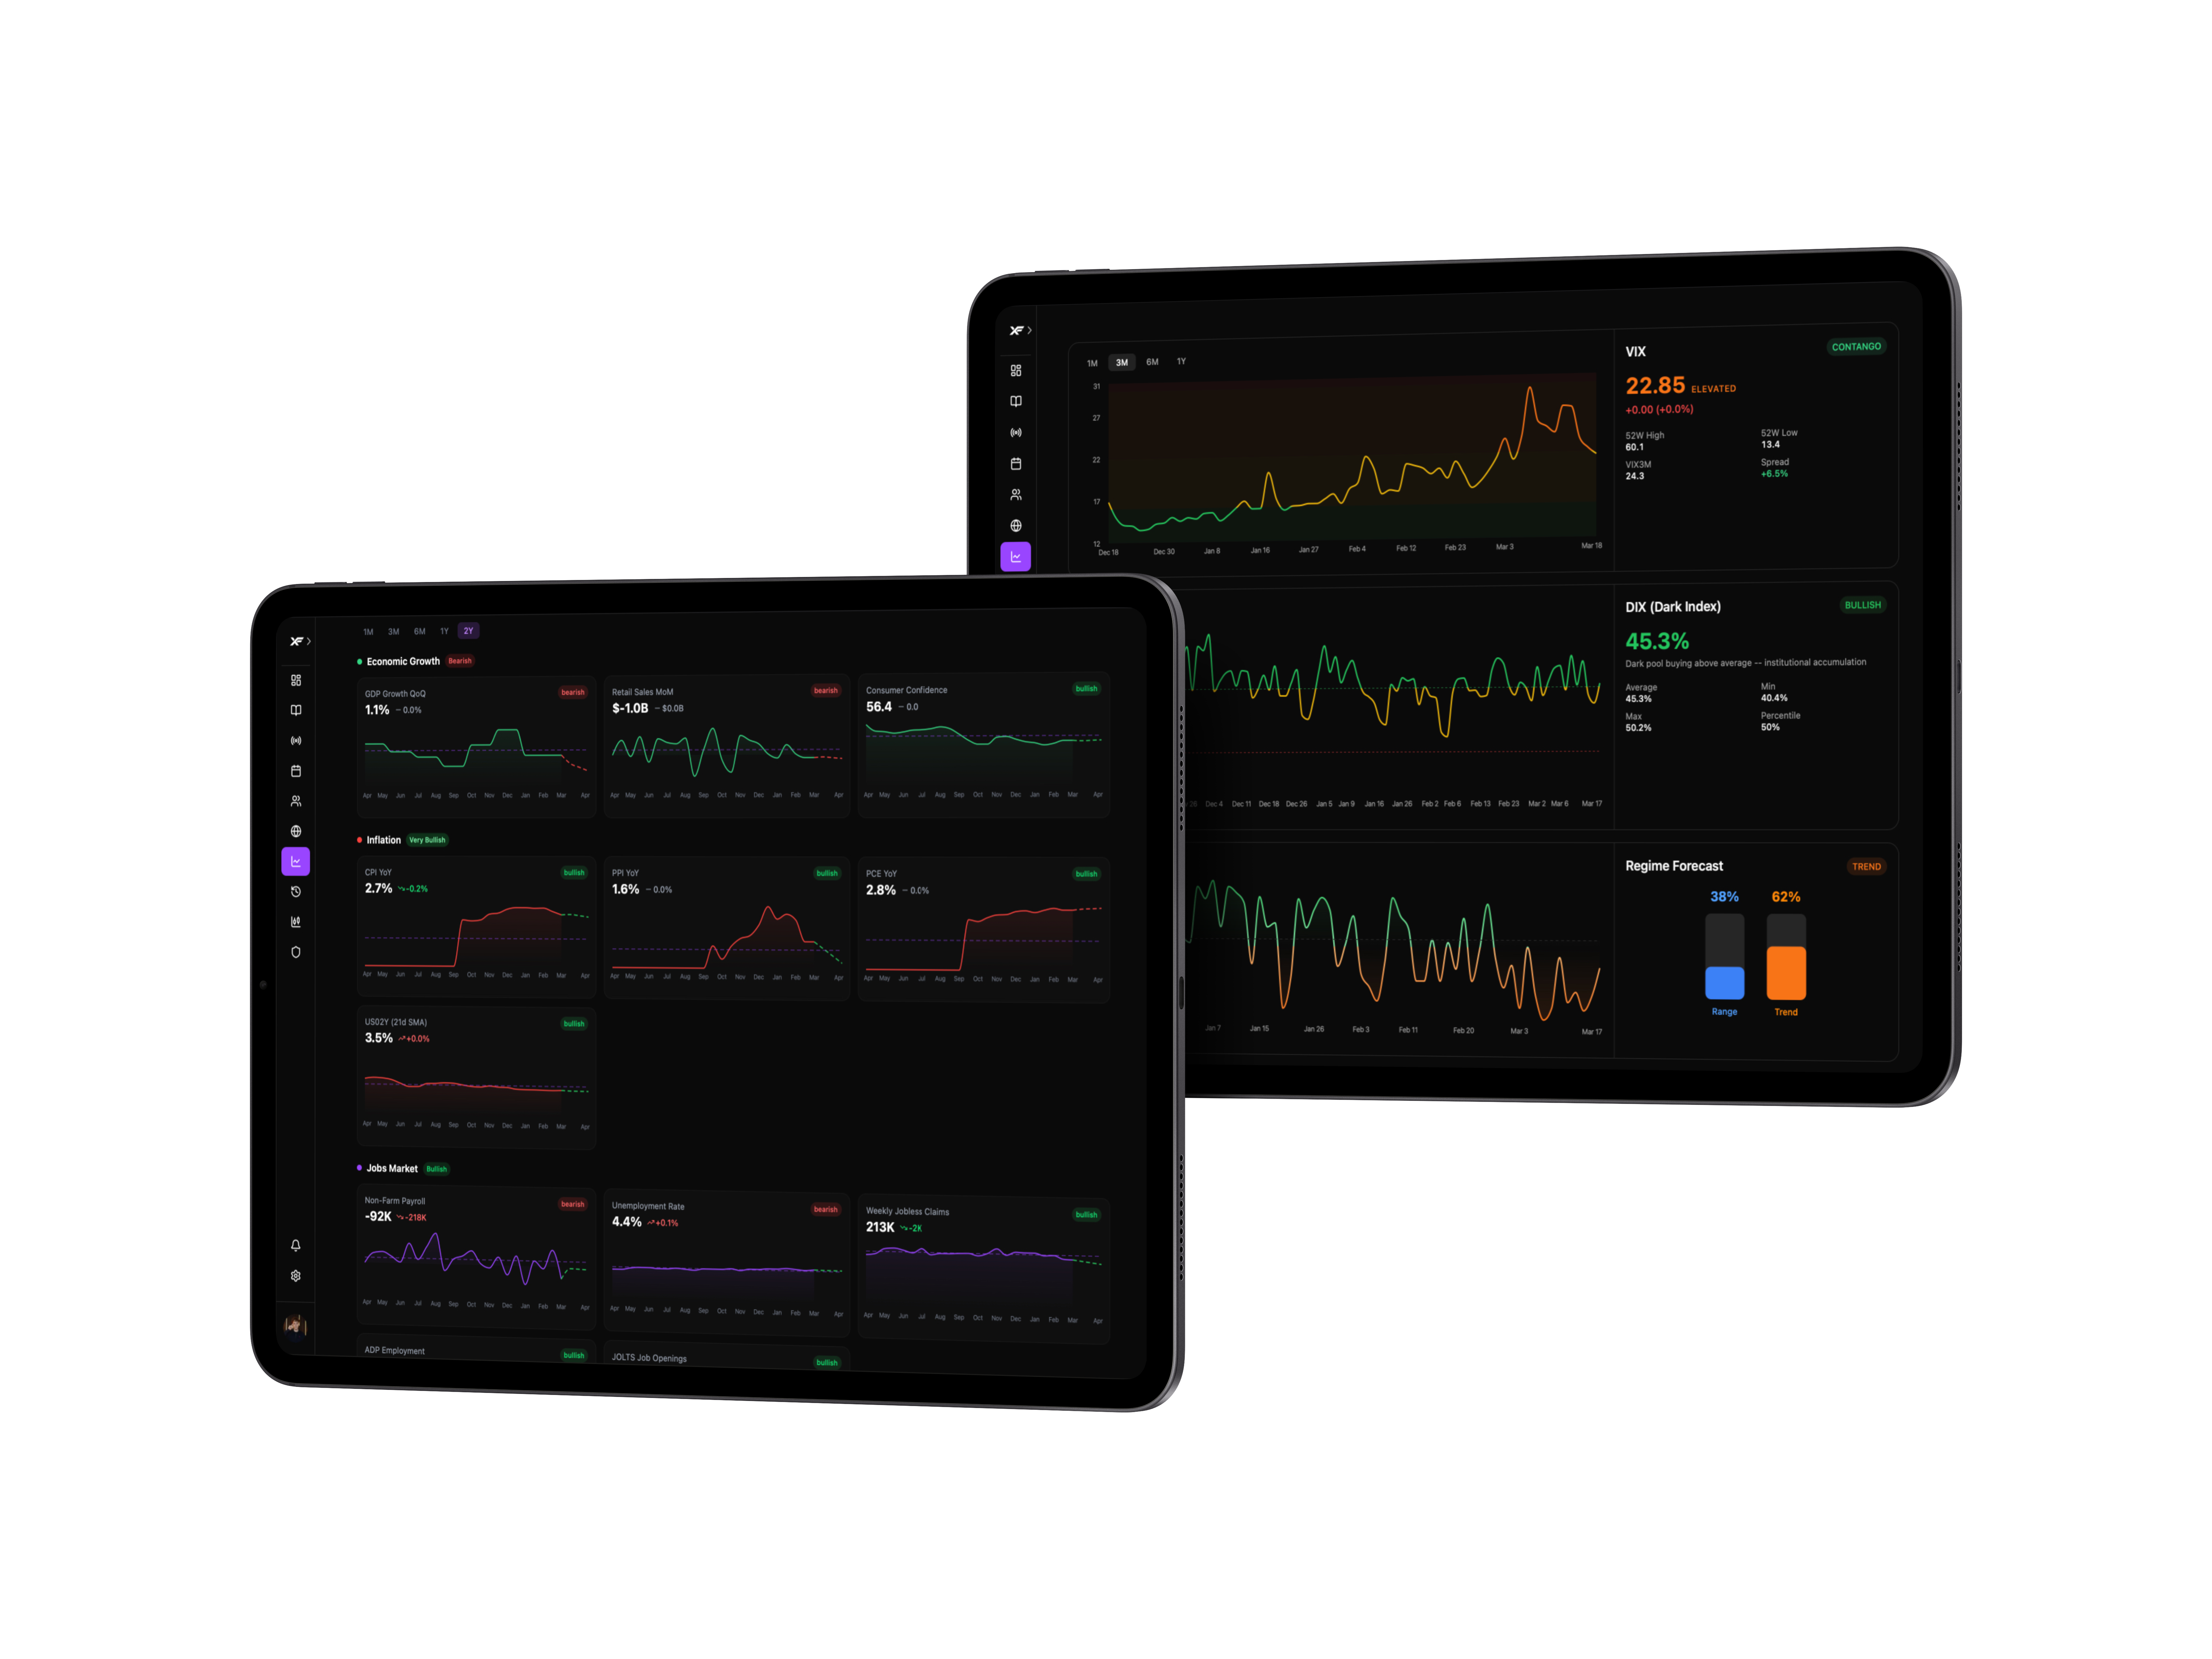
Macro Dashboard
Get a complete overview of the macroeconomic landscape in one place. Analyze key indicators, market trends, and institutional positioning to understand what is driving the markets right now.
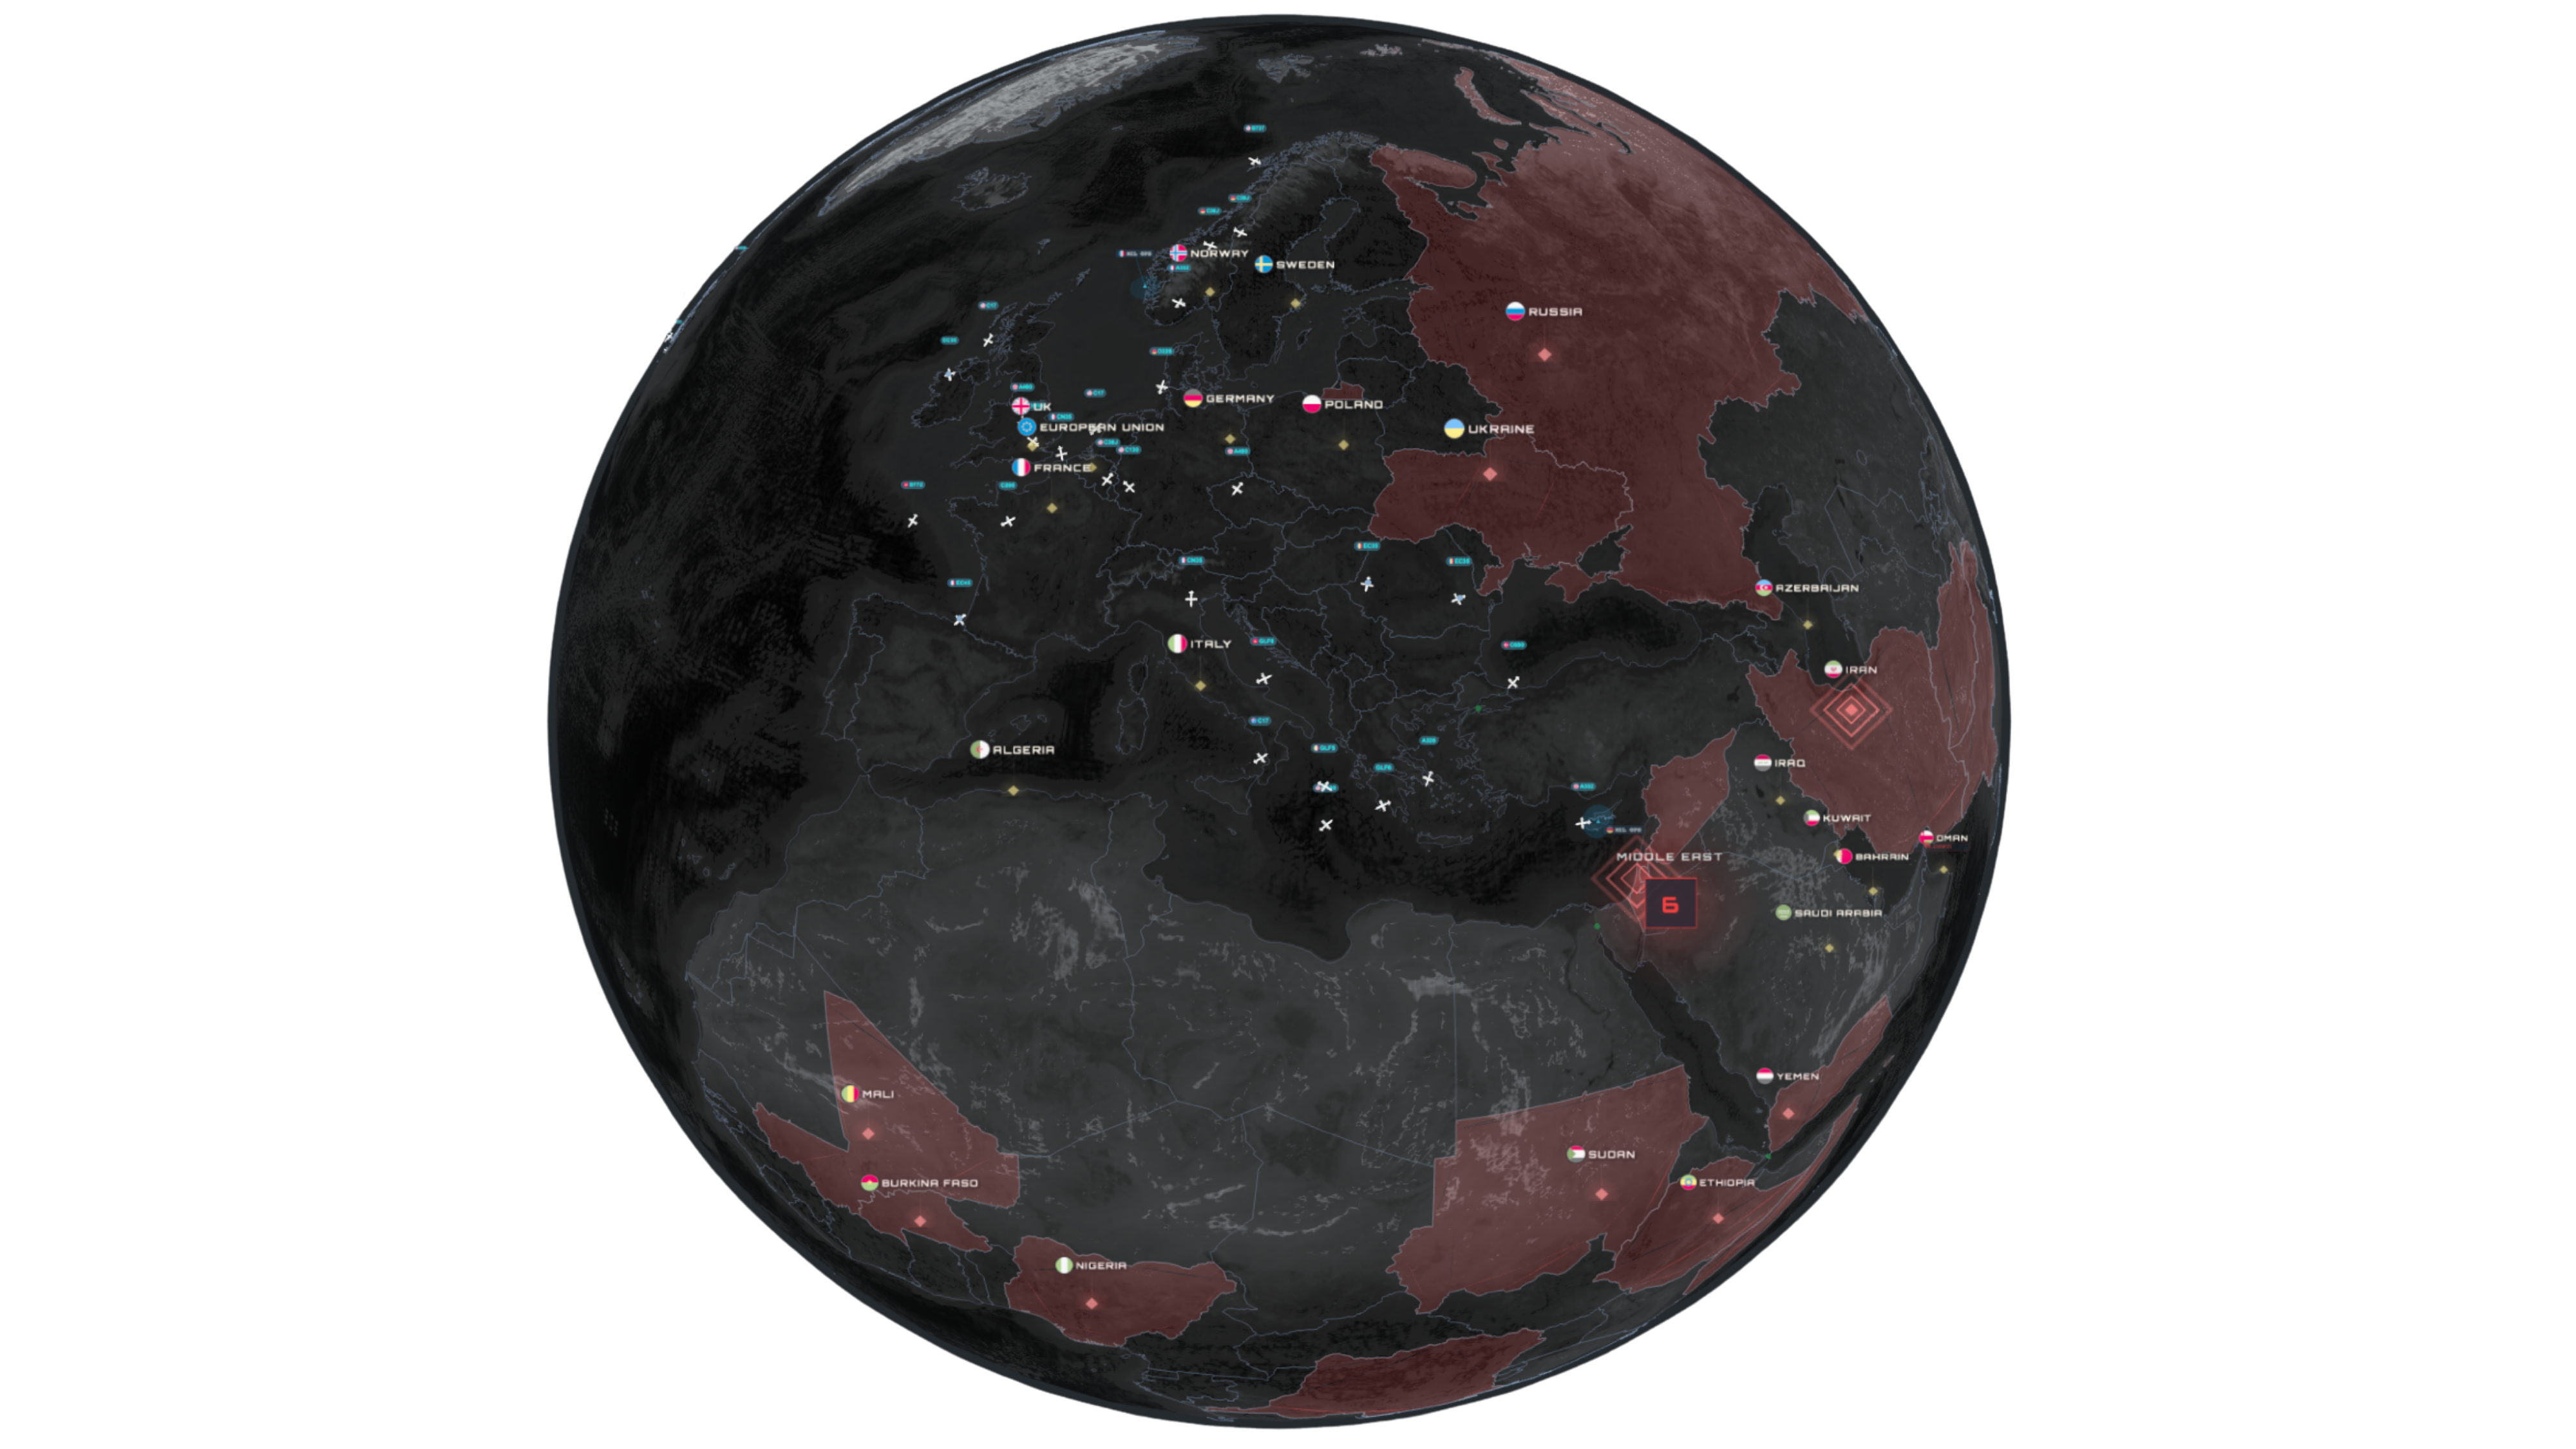
Geopolitical Map
Track global geopolitical events in real-time on an interactive map. Understand how conflicts, sanctions, elections, and policy changes impact the markets you trade.
Market Indicators
COT positioning, ESI, VIX regime, DIX dark pool indicator, market regimes, currency strength, and market breadth — all visualized and auto-updated. Know how big players are positioned and what the broader market is doing.
Live Economics Feed
Never miss a market-moving event. Live news feed with every economic release, AI-analyzed impact weight, and historical context. See previous, forecast, and actual values the moment they drop.
Custom Widgets
Build your own terminal view. Drag, drop, and resize widgets to create the perfect macro dashboard for your trading style. Save layouts and switch between them instantly.
Market Seasonality
Discover historical seasonal patterns in the markets. See how assets tend to perform during specific months, weeks, and time periods to align your trades with recurring trends.
Company Earnings
Track upcoming earnings reports, revenue estimates, and EPS surprises. Know exactly when major companies report and how their results compare to expectations.
Volume Spread Analysis
Understand the relationship between price spread, volume, and closing position. Identify accumulation, distribution, and smart money activity behind the candles.
GEX AnalysisSoon
Gamma Exposure analysis to understand dealer hedging flows and predict key support/resistance levels based on options positioning. Currently in development.
Stop guessing
Start analyzing
“I used to check five different websites for COT data, VIX, and economic events. Now I open one tab and everything is there. My pre-market routine went from 30 minutes to 5.”
Martin K.
Joined 3 months ago
“The ESI chart completely changed how I trade news events. I can see at a glance whether data is beating or missing expectations. No other free tool does this.”
Petr S.
Joined 6 months ago
“COT positioning data in a clean visual format instead of raw CFTC spreadsheets. I finally understand how commercials and speculators are positioned. This should not be free.”
Anna H.
Joined 2 months ago
“The economic calendar is the best I have used. Impact filtering, real-time updates, and it is integrated with everything else. Replaced my paid TradingView subscription for macro.”
Tomas N.
Joined 4 months ago
“VIX regime analysis helped me stop trading during the worst volatility conditions. My drawdown dropped significantly since I started checking XF Terminal before every session.”
Jakub D.
Joined 1 month ago
“Cannot wait for GEX to launch. Already the COT and ESI tools alone make this the best free macro terminal available. The team keeps shipping new features constantly.”
Lukas M.
Joined 5 months ago
Simple pricing
Full access, no limits
One plan, everything included. Choose quarterly or save with annual.
Quarterly
$40 /month
Billed $120 / Quarterly
Annual
$30 /month
Billed $360 / Annually
Frequently asked
Everything you need to know about XF Terminal. Can't find the answer you're looking for? Reach out to us.
Still have questions?
Contact usXF Terminal is a browser-based macro analysis platform built by XFlow Trading. It provides a macro dashboard, geopolitical map, COT reports, ESI, VIX analysis, a live economics feed with AI impact analysis, custom widgets, and soon GEX — all free, in one place.
Yes! XF Terminal is completely free for all traders. Every tool — macro dashboard, geopolitical map, COT, ESI, VIX, live economics feed, custom widgets — is included at no cost. Just create your account and start analyzing.
We source data from official providers including CFTC for COT reports, major economic data aggregators for ESI and calendar events, and CBOE for VIX data. All data is processed and visualized automatically.
No. XF Terminal runs entirely in your browser. No desktop app, no plugins, no downloads. Works on any modern browser on any device.
GEX (Gamma Exposure) analysis shows dealer hedging flows and helps predict key support/resistance levels based on options positioning. It is currently in development and will be available soon.
Economic calendar and VIX data update in real-time. COT reports are updated weekly when the CFTC publishes new data (every Friday). ESI updates as new economic releases come in.
Simply create a free account and you will immediately get access to all tools — macro dashboard, geopolitical map, COT, ESI, VIX, live economics feed, and custom widgets. Everything is free.